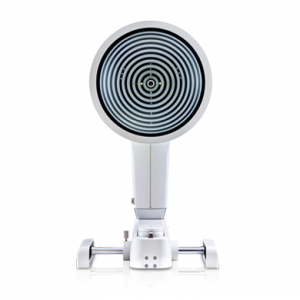
Acquisition Mode: Multi shot, tube, movie
ISO Management: Variable
Grids: Placido disc, NIBUT grid
Light source: Infrared LED – Blue and White LED
Image Resolution: 8 mp
Focus: Autofocus, Manual focus
Camera: Colored, Sensitive to Infrared (NIR)


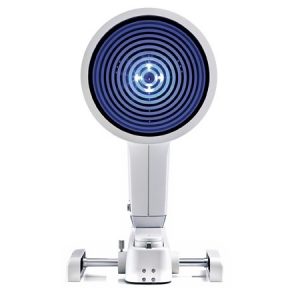
Acquisition Mode: Multi shot, tube, movie
ISO Management: Variable
Grids: Placido disc, NIBUT grid
Light source: Infrared LED – Blue and White LED
Image Resolution: 8 mp
Focus: Autofocus, Manual focus
Camera: Colored, Sensitive to Infrared (NIR)
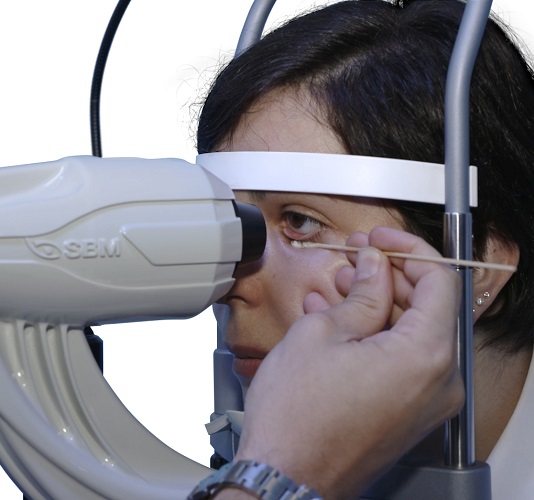
A full assessment of the ocular surface through a combination of tests for dry eye diagnosis, from tear break up time to the tear volume production test.
ICP Dry Eye analysis
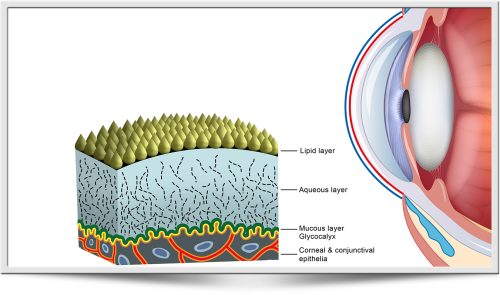
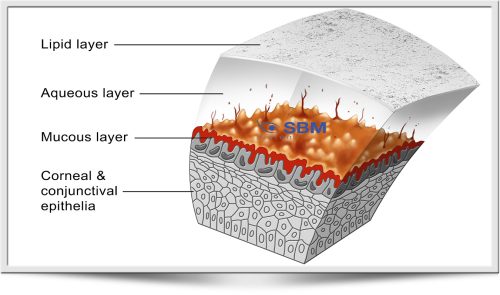
I.C.P OSA the new instrument of individual analysis of lacrimal that allow with a quick detailed structural research of the tear composition.
Possibility of researsch on the single layers:
Thanks to ICP OSA is possible to identify the type of DED(Drye Eye Desease) and determine which deficient layers can be treated with a specific treatment.
MGD Analysis meibomian gland desease
Easily and efficiently integrates complex examinations such as meibography and tear film interferometry screening.
 Dry Eye is commonly by the Meibomian Gland Dysfunction (MGD). The Meibo-Scan shows the morphological changes in the glandular tissue.
System analysis of the images obtained through a sensitive infrared camera (NIR) allows to evaluate in a guided way:
For a better evaluation, the brightness of the picture can be modified by the editor system.
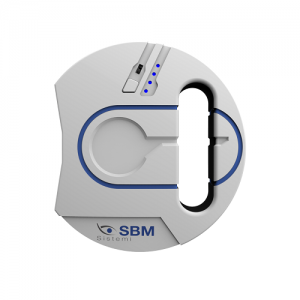
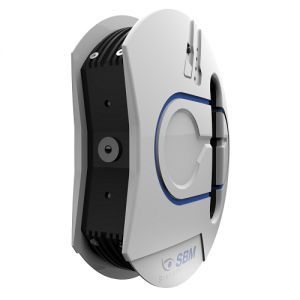
| Tipology: | Ocular surface analysis device |
| Image resolution: | 8.000.000 pixel |
| Photo resolution: | 2592×1944 JPEG format |
| Acquisition mode: | Multi shot, movie |
| Focus: | Autofocus, manual focus |
| ISO management: | Variable |
| Camera: | Coloured, sensitive to infrared (NIR) |
| Light source: | Infrared LED – Blue and white Led |
| Accessories: | Placido disc, NIBUT grid |
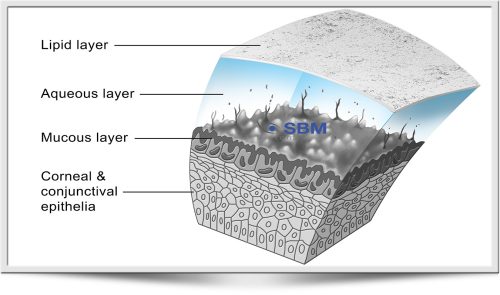
 N.I.B.U.T
To evaluate the tear film break-up time in a non invasive and fully automated way. In the B U T test the presence of fluorescein in the tears may stimulate reflex tearing and may also change tear film properties.
To overcome these potential inconvenients a non-invasive procedure may be used.
In the dog and the cat third eyelid movements may prevent NIBUT exam.
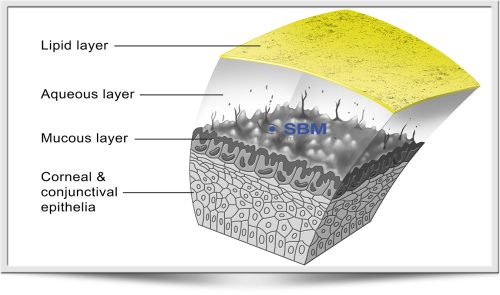
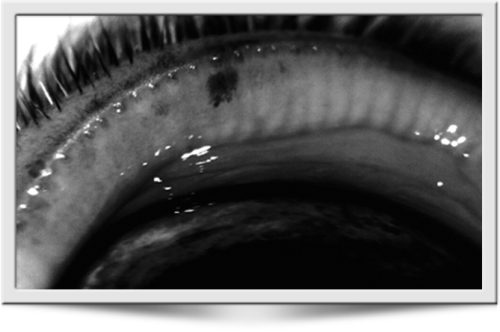
Lipid layer
 EVALUATION OF THE LIPID LAYER THICKNESS
The color and structure of the lipid layer is visible and can be recorded.
The lipid layer pattern depends on its thickness, which correlates with tear film evaporation and dry eye clinical signs.
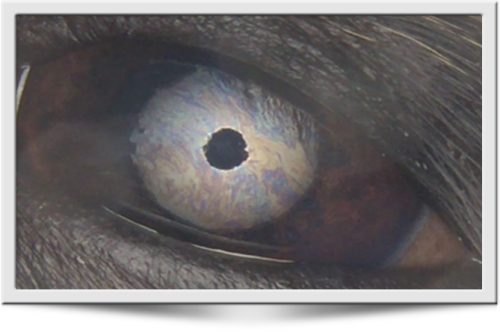
Tear meniscus-height
In dogs and cats the PTF thickness is about 8 μ on the cornea but it is much thicker at the meniscus, where in human being reaches up to 0,2 to 0,5 mm (200- 500 μ).
By examining the meniscus it is possible to evaluate the lacrimal gland acqueous production.
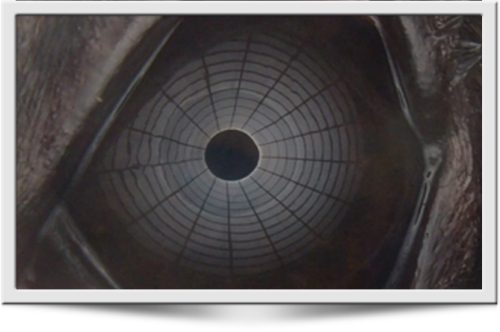
Corneal Placid Plate Warpage
To evaluate corneal distortion and tear film defects by the projection of Placido rings on ocular surface.
ICP Dry eye analysis
I.C.P. Tearscope is an instrument available to veterinary ophthalmologists and practitioners to evaluate the composition and stability of the precorneal tear film (PTF).
It allows to better evaluate PTF qualitative deficiencies and make an accurate diagnosis of evaporative Dry Eye Disease (DED) due to imbalance of the three main PTF components:
Thanks to ICP Tearscope it is possible to identify the type of DED and determine which deficient layer is affected and select a specific treatment.
ICP OSA allows to quantify directly and indirectly each single layer
The white LEDs are used to display the phenomenon of interference fringes, allowing to evaluate the thickness of the lipid component of the tear and run the Break Up Time ( NIBUT) and Non Invasive Dehydration Up Time (NIDUT).
The blue LED (when using fluorescein) allows you to observe the bulbar or corneal staining and run the Break Up Time (BUT).
By evaluating the tear meniscus, it is possible to directly perceive and measure the PTF watery component.
Lipid analisys layer
Through a quick and easy acquisition of a series of 3 blinks, ICP Tearscope allows to obtain the thickness of the single lipid layer of the tear film, classifying it in 3 to 5 different categories in a quick and precise way.
It is possible to refer to a grading scale for detailed classification and follow up.
For a detailed analysis of the mucin layer, ICP Tearscope evaluates the non invasive break up time and the lipid layer. By matching the two exams it’s possible to better evaluate the stability of the precorneal tear film.
By using the fluorescein stain, it’s possible to perform the classic TBUT.
Supplied accessories
The system is provided with a kit of useful grids to perform various screening. All filters are already present in the Tearscope.
• Measurement of BLACK LINE (MLMI)
• Evaluation of the corneal surface to check for irregular patterns and structural defects
• Blue and white Led
• A thick grid to observe the quality of the tear film
• A fine grid to evaluate the quality and the structure of tear and measure the N.I.B.U.T.
• A Placido’s disc to highlight possible distortions or corneal and tear film irregularities
Immediate interpretation and follow up
By using a dedicated lipid layer GRADING SCALE, each interference pattern may be examined in a simple and straightforward way
 Automatic detection module area of Meibomian Glands
ICP can, in a guided way, detect the length and width of meibomian glands imaged by infrared meibography without requiring any input form the user.
The images are then automatically classified.
 Diagnostic Testing Dermatologic Diagnostic minimum data base includes skin scrapes, otic swabs, and cutaneous cytology. The goal should be to identify all secondary infections (pyoderma, demodicosis, dermatophytosis, otitis, Malassezia dermatitis, and pododermatitis)
then formulate a diagnostic plan to identify and control the underlying/primary disease (ie. allergies, endocrinopathies, keratinization defects, and autoimmune skin diseases).
Skin cytology—the microscopic evaluation of material collected from the skin—provides valuable information that helps determine:
Technicians can collect samples for skin cytology via direct impression smear using clear adhesive tape to lift the sample, a cotton swab to obtain exudate, or metal spatulas (or something similar) to obtain material from nail beds.
Pupillary light reflex (PLR) is a simple noninvasive neurological test that can reveal a great amount of information of the neural system. We report here a novel imaging system for measuring PLR without using any restraints to limit the subject’s movement. Our system incorporates a tracking component that can locate the subject’s eye position and redirect the pupillary imaging component to follow the subject’s movement. This system can measure PLR, at a distance from the subject, with high spatial resolution (
Pupil light reflex (PLR) describes the phenomena that the pupil size changes in response to illumination changes at the retina. Pupil size is controlled by two antagonistic muscles in the iris: the sphincter and dilator, which are modulated by the parasympathetic and sympathetic innervation to constrict and dilate, respectively [1]. Dysfunctions in any part along the PLR pathway including the retina, optical tract, pretectal nucleus, midbrain nucleus, and ciliary ganglion may alter the normal PLR response. Pupillary response is conventionally used as a quick test for brain injury in the emergency room by flashing a medical penlight on the eyes. With the assistance of computerized quantitative measurements, PLR has emerged as a potential noninvasive test for identifying various ophthalmological disorders and neurological disorders [2–8].
In a typical PLR measurement, images of the pupil are continuously acquired for a period from a few seconds to minutes while the subject’s eye is stimulated using an optical flash with a predetermined intensity, duration, and spectrum. An image processing method is then applied to calculate the pupil size (area or radius) before, during, and after the optical stimulation. The obtained “pupilogram” curve describes the temporal course of pupil size changes, from which multiple PLR parameters such as constriction amplitude, latency, constriction, and recovery time can be calculated.